There is one factor in the silver market that the Fiat Monetary Authorities and Banking Institutions are deeply concerned about. It has to do with controlling the public’s understanding of what is “Real Value” versus “Perceived Value.”
While the Fed and its cohorts in the banking industry continue to print money as well as offer plenty of digital liquidity to give the illusion of solvency in the financial system, cracks are beginning to appear as more investors become reacquainted to the 2,000+ year history of silver money.
Things are starting to get out of hand as Central Bank monetary printing goes exponential. This is clearly seen by the huge expansion of Canadian base currency.
Mike describes the increase of Canadian base currency in the last decade as “Outrageous.” You can see the short video at the link: Outrageous Canadian Monetary Expansion.
The only way the Central Banks can continue their insane policy of monetary debasement, is by controlling the public’s confidence in the currency. Because gold and silver are competing currencies, they pose a threat to this current great transfer of wealth to the rich.
Which is the very reason the value of gold and silver are manipulated. Anyone who thinks otherwise is either a NITWIT, or has a vested interest in bending over for one’s fiat monetary masters.
Silver Investment Demand Is The Factor The Fiat Monetary Authorities Are Worried About
The world supplies enough silver a year to meet its industrial, jewelry, silverware and photography needs, however, rising investment demand is the factor that could seriously throw the whole balance out-of-whack.
Many of the typical run-of-the-mill analysts which you can find taking up space at one of the fine banking and brokerage institutions, continue to focus on industrial demand as a key driver for the silver price in the future. I totally disagree.
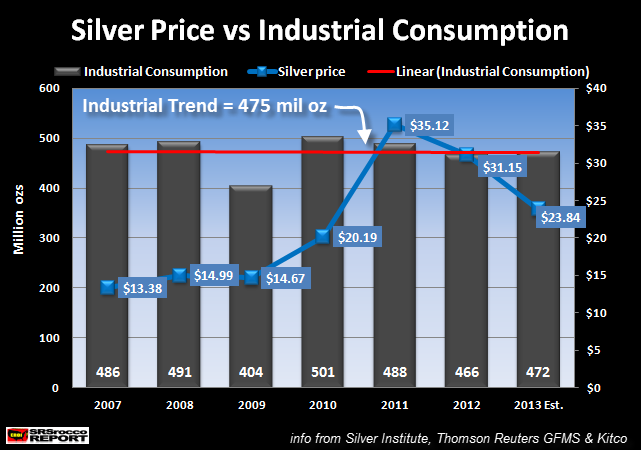
Silver consumption by industrial applications remains relatively flat at an average 475 million ounces over the past six years.
Even though these same analysts provide forecasts of increased silver demand by industrial applications within the coming decade, peak oil will put a cap on growth in this sector. We may see a small increase of silver consumption by industrial applications, but nowhere near analysts’ forecasts.
GFMS produced a report for the Silver Institute on silver consumption in the Industrial sector. This report released in March of 2011, had the following chart:
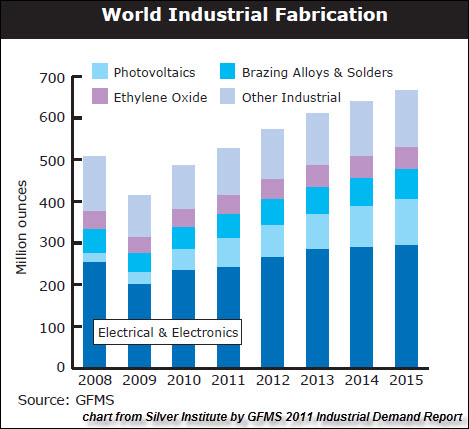
This chart showing approximately 485 million oz for 2010 was produced before revisions were made in their 2011 World Silver Survey.
As you can see from my chart above, the world consumed 501 million oz of silver for industrial applications in 2010, the highest amount ever. According to this chart, GFMS forecasted industrial silver consumption to reach 600 million oz by 2013.
Thomson Reuters GFMS will put out their 2014 World Silver Survey later this month with data and figures for 2013. However, in their Silver Update provided November last year, they forecasted industrial silver consumption to increase five million ounces over 2012…. which puts the total at a whopping 477 million.
As we can see, it didn’t even come close to their 600 million oz forecast.
While industrial silver consumption remained virtually flat since 2007, demand in another sector grew substantially. In just six years, the demand for Official Silver coins increased from 39.7 million oz in 2007 to 136 million oz in 2013. The 136 million oz figure was provided by the CPM Group in a press release of their 2014 Silver Yearbook.

Here we can see that demand for Official Coins (Silver Eagles, Maples, Philharmonics, Pandas and etc) is in an upward trend, increasing nearly 100 million oz (240%) since 2007, while growth in the industrial sector is dead as a doorknob.
If we combine the total amount from the other sectors that consume silver, jewelery-silverware-photography fell from 363 million oz in 2007 to a forecasted 298 million oz in 2013 (according to data from the GFMS Nov 2013 Silver Update).
While industrial silver demand remained flat since 2007, the net gain of 31 million oz came from increased Official Coin Sales:
Estimated Change from 2007-2013
Official Coin Sales = +96 million oz
Jewelry-Silverware-Photography = -65 million oz
Net change = +31 million oz
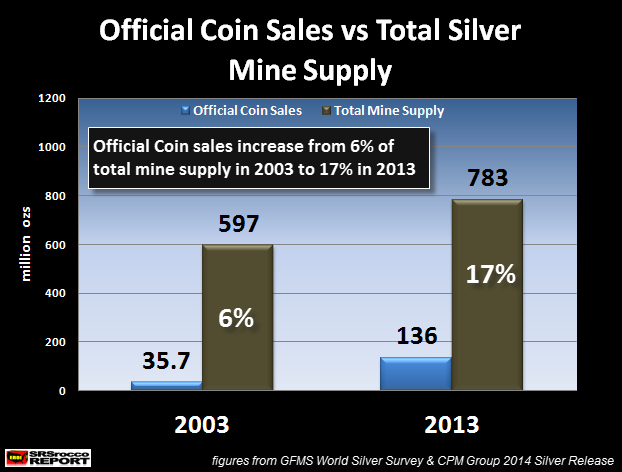
Furthermore, Official Coin sales now represent 17% of total mine supply compared to 6% in 2003:
So, the real winner in silver demand… goes to “Official Coin Sales.” Of course this is only part of the story, but I believe it will become more of an important factor in the future.
Global Silver Mine Supply Continues To Grow, But Government Sales Fall Off A Cliff
Total world mine supply increased from nearly 600 million oz in 2003 to an estimated 783 million oz in 2013. I estimated total mine supply by averaging CPM Group’s 763 million oz figure with GFMS estimated 804 million oz for 2013.
As mine supply increased over 180 million oz since 2003, net government silver sales…. dropped like a rock.
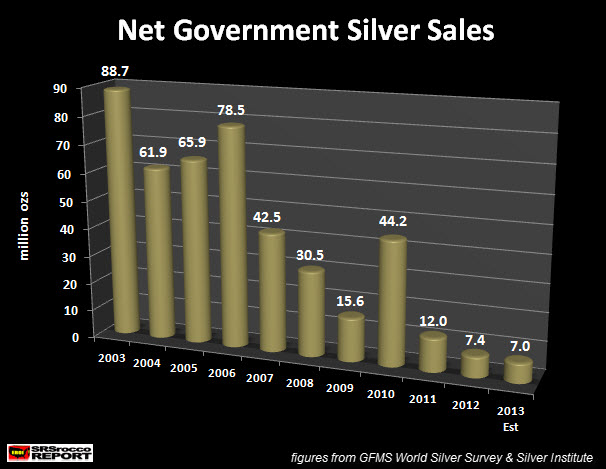
According to the Silver Institute (figures provided by GFMS), net government silver sales fell from 88.7 million oz in 2003 to an estimated 7 million oz in 2013. We can no longer depend on additional supplies of silver from either Chinese, Indian or Russian governments.
Matter-of-fact, I would imagine these BRIC countries will now hold onto and possibly increase their government silver stocks for strategic industrial and economic purposes in the future.
Even though world silver mine production is likely to increase for the next several years, peak oil will push the extremely fragile global financial system over the edge, putting a real Kibosh on future silver supply by the end of the decade.
“Real” versus “Perceived” Wealth-Value
Americans continue to invest in the biggest Ponzi Scheme in history… many are completely clueless. Due to the Fed’s QE – Quantitative Easing policy, a great deal of perceived wealth made its way into the stock and bond markets.
In a just five quarters, the U.S. Retirement Market increased from $19.5 trillion (Q3 2012) to $23 trillion (Q4 2013). This was an amazing 18% increase in 16 months time. Why on earth would the typical American give much thought to investing in gold or silver when their retirement plans are making them rich?

In comparison, if we add up all the Gold & Silver Eagles sold to date and then multiply them at the current spot plus a fair premium, total value of these coins represents $36 billion. Moreover, the current value of the GLD & SLV ETF’s is $40 billion. These two investments don’t even register on the chart… they are nothing more than a flat smudge on the graphic.
I gave a conservative 1% ownership of U.S. gold and silver assets ($230 billion) compared to the U.S. Retirement market. The precious metal market is still supported by a small fraction of U.S. citizens.
The reason the fiat monetary regime is worried about silver investment demand is that it could throw a monkey-wrench into their plan of controlling the price of silver. So.. if the price of silver gets out of hand, so does the ability to keep confidence in the U.S. Dollar and all the worthless paper assets that are tied to it — such as the U.S. Retirement Market.
During the latter part of the 1970′s decade when the price of silver skyrocketed towards $50 an ounce, investors were increasingly buying silver. According to the Silver Institute’s 1979-80 price history:
World economic and political events also were coming to bear on the silver market, most notably in the form of a major cyclical upward surge in inflation throughout the industrialized world. Sensing that silver prices should be adjusting upward to compensate for these inflationary trends, many investors decided that silver prices between $4.00 and $5.50, which had prevailed during most of the late 1970s, were too low. Investors ceased selling their old silver holdings, and instead began adding to their holdings. This added further upward pressure to the price of silver. Simplistic retrospectives of the silver market in late 1979 tend to focus on the high-profile purchases of large amounts of silver and silver futures by various wealthy individuals; in reality, there was a tremendously broad-based rush to buy silver by investors worldwide at the time.
As silver prices rose above $15.00 in September 1979, fabrication demand began to be affected. On an annual average basis, industrial silver use fell a relatively mild 0.9% to 445.1 million ounces in 1979. Demand had held up reasonably well during the first three quarters of the year. However, a sharp cut-back in demand in the fourth quarter led to overall annual decreases in silver use. By some estimates, industrial use of silver was 40% lower in the last quarter of 1979 than it had been in the first quarter of that year.
Investors worried about inflation stampeded into silver during 1979. This also caused the price to continue to rise. However, a high price impacted industrial usage which fell 40% during the last quarter of 1979. On the other hand, the higher price of silver in 2011 (average $35.12) had a much less impact on industrial consumption than it did in 1979.
Industrial silver consumption only declined 13 million oz from 501 million oz in 2010 to 488 million oz in 2011. Again, as my chart above shows, industrial consumption remained flat regardless of the movement in price.
With the price of silver reaching nearly $50 in 2011, 5 margin hikes guaranteed the end of that short-term bull market. In the past three years the silver market has been in a slow grinding decline. However, retail investment demand for silver has picked up considerably as prices continue to fall.
This is quite different from what took place in the silver market between 1982-83. Again, according to the Silver Institute’s 1981-90 decade:
In late 1982 investor interest in silver was rekindled by several forces, all of which emerged at roughly the same time. The international financial market panic led some investors to turn to silver. Others were attracted by what they saw as unsustainably low prices. Investment demand also was encouraged by a rapid easing of credit market conditions by monetary authorities in most industrialized nations; this easing led to an immediate revival of inflation fears. As a result of all of these forces coming to bear at once, investment demand picked up during the second half of 1982 and the first quarter of 1983. This influx of investor buying helped take silver prices from the June 1982 low of $4.98 to a peak of $14.72 in March 1983.
It was the increase of silver investment demand that pushed the price of silver from a low of $4.98 in June 1982 to a high of $14.72 in March 1983. Interestingly, quite the opposite took place in 2013. As investors purchased 35-40 million oz more Official Silver Coins than 2012, the price of silver fell from $32 in Jan 2013 to a low of $19 by year end.
Now, we don’t know how much additional physical silver demand came in the form of wholesale bars, smaller bars and standard rounds in 2013. I would imagine this figure increased as well. Some of this data will be released in the 2014 World Silver Survey.
The big difference between 1982-83 and 2013, is that the Fed and Central Banks were not funneling $trillions of monetary liquidity into the Stock, Real Estate and Bond Markets during the 1980′s. To keep the price of silver in check after its peak in 2011, the fiat monetary authorities thought a severely depressed silver price would distract investment demand.
Unfortunately for them, retail investors are buying more silver in the form of official coins than ever. Even though official coin demand may seem insignificant compared to the entire global financial market… it is a crack that is beginning to appear in the Fiat Monetary system.
Peak oil, the falling EROI (Energy Returned On Invested) and the decline of net oil exports are putting severe stress on the already weakened global financial system. The $23 trillion U.S. Retirement Market is nothing more than a huge Ponzi scheme which needs to be fed by a growing energy supply.
Because the world plateaued in global conventional oil production since 2005, the Fed and Central Banks embarked on the greatest monetary printing policy to give the ILLUSION OF GROWTH… when little or none existed.
Silver investment demand will be one of the key factors that will push the value of silver to new highs. As more Americans realize they have invested in increasingly worthless paper assets, more will be motivated to move into physical assets such as silver to protect their wealth.
The huge increase of official silver coin demand over several years is just one clue that this trend is gaining speed.